Interessanti statistiche sulle auto elettriche in Europa e in Italia
Interessanti statistiche sulle auto elettriche in Europa e in Italia: grafici e tabelle sui dati di vendita degli EV e sulla diffusione delle infrastrutture di ricarica.
Statistiche sulle auto elettriche. In questo articolo abbiamo intenzione semplicemente di mostrarvi alcuni grafici e tabelle inerenti ai dati sulle vendite di auto elettriche (sia “pure” che ibride plug-in) e sulle installazioni delle stazioni di ricarica in Europa. Le informazioni sono prelevate dal sito Web dell’EAFO (European Alternative Fuels Observatory ovvero Osservatorio Europeo dei Carburanti Alternativi): un’iniziativa finanziata direttamente dalla Commissione Europea.

L’EAFO è stato creato per supportare lo sviluppo dei carburanti alternativi nel settore dei trasporti in Europa ed aiutare gli Stati Membri nell’implementazione della Direttiva 2014/94/UE riguardante lo sviluppo di stazioni di rifornimento e ricarica. La Direttiva richiede agli Stati Membri di assicurare una copertura geografica minima per il rifornimento di certi combustibili alternativi entro il 2020, 2025 e 2030. L’obiettivo dell’EAFO è di raccogliere tutti i dati esistenti sui carburanti alternativi (fino a poco tempo fa frammentati e non controllati) ed eseguire i controlli necessari per assicurare informazioni e dati affidabili.
Statistiche sui veicoli
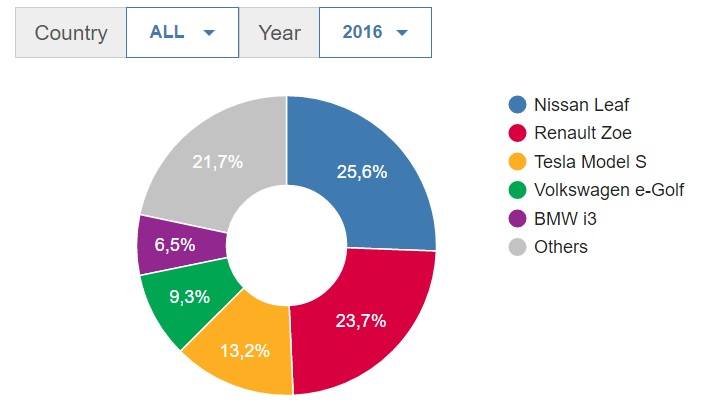
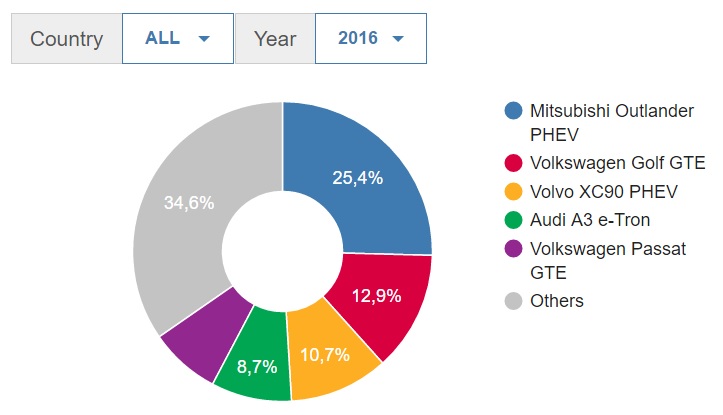
Di seguito si riportato i diagrammi a torta rispettivamente delle cinque vetture completamente elettriche (BEV) e delle cinque vetture ibride plug-in (PHEV) più vendute in Europa nel 2016.
Top 5 BEV
Top 5 PHEV
Questa è la tabella che riassume tutti i dati relativi alle vendite di auto elettriche a batteria (BEV) in Europa negli ultimi 5 anni:
| Ranking | Make | Model | YTD 2016 | Share PEV market | YTD 2015 | 2015 Total | Share PEV market | 2014 Total | 2013 Total | 2012 Total | 2011 Total |
|---|---|---|---|---|---|---|---|---|---|---|---|
| 1 | Nissan | Leaf | 8058 | 12,5% | 5985 | 15230 | 8,1% | 14620 | 10868 | 5376 | 1740 |
| 2 | Renault | Zoe | 7466 | 11,5% | 4663 | 18536 | 9,8% | 11029 | 8833 | 68 | 0 |
| 3 | Tesla | Model S | 4166 | 6,4% | 4288 | 15986 | 8,5% | 9550 | 3975 | 0 | 0 |
| 4 | Volkswagen | e-Golf | 2918 | 4,5% | 4377 | 11161 | 5,9% | 2929 | 0 | 48 | 0 |
| 5 | BMW | i3 | 2056 | 3,2% | 1431 | 6187 | 3,3% | 5412 | 996 | 0 | 0 |
| 6 | Kia | Soul EV | 1425 | 2,2% | 742 | 7782 | 4,1% | 595 | 0 | 0 | 0 |
| 7 | Unknown | BEV Model | 1051 | 1,6% | 121 | 380 | 0,2% | 99 | 10 | 1 | 21 |
| 8 | Mercedes | B250e | 979 | 1,5% | 554 | 2818 | 1,5% | 185 | 0 | 0 | 0 |
| 9 | Volkswagen | e-Up! | 873 | 1,3% | 1188 | 2962 | 1,6% | 5840 | 940 | 0 | 0 |
| 10 | Peugeot | iOn | 695 | 1,1% | 362 | 1460 | 0,8% | 576 | 695 | 3125 | 1849 |
| Others | / | / | 1806 | 2,8% | 2253 | 6374 | 3,4% | 6289 | 6602 | 9807 | 7419 |
Questa è, invece, la tabella che riassume i dati relativi alle vendite di auto ibride “alla spina” (PHEV) in Europa negli ultimi 5 anni:
| Ranking | Make | Model | YTD 2016 | Share PEV market | YTD 2015 | 2015 Total | Share PEV market | 2014 Total | 2013 Total | 2012 Total | 2011 Total |
|---|---|---|---|---|---|---|---|---|---|---|---|
| 1 | Mitsubishi | Outlander PHEV | 8293 | 12,8% | 9394 | 31176 | 16,5% | 20043 | 8193 | 0 | 0 |
| 2 | Volkswagen | Golf GTE | 4224 | 6,5% | 3547 | 17457 | 9,2% | 768 | 0 | 0 | 0 |
| 3 | Volvo | XC90 PHEV | 3487 | 5,4% | 0 | 2820 | 1,5% | 0 | 0 | 0 | 0 |
| 4 | Audi | A3 e-Tron | 2831 | 4,4% | 2930 | 12223 | 6,5% | 729 | 0 | 0 | 0 |
| 5 | Volkswagen | Passat GTE | 2495 | 3,9% | 17 | 4815 | 2,5% | 0 | 0 | 0 | 0 |
| 6 | BMW | X5 40e | 2073 | 3,2% | 3 | 1535 | 0,8% | 0 | 0 | 0 | 0 |
| 7 | Mercedes | C350e | 1539 | 2,4% | 55 | 5360 | 2,8% | 0 | 0 | 0 | 0 |
| 8 | BMW | i3 Rex | 1406 | 2,2% | 1615 | 5582 | 3,0% | 3633 | 536 | 0 | 0 |
| 9 | Volvo | V60 PHEV | 1150 | 1,8% | 1796 | 7346 | 3,9% | 5462 | 8032 | 37 | 0 |
| 10 | BMW | 225xe Active Tourer | 1096 | 1,7% | 8 | 266 | 0,1% | 0 | 0 | 0 | 0 |
| Others | / | / | 4040 | 6,2% | 3360 | 11321 | 6,0% | 5350 | 9728 | 9719 | 367 |
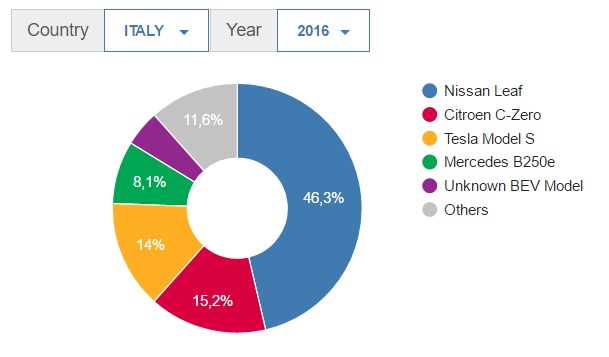
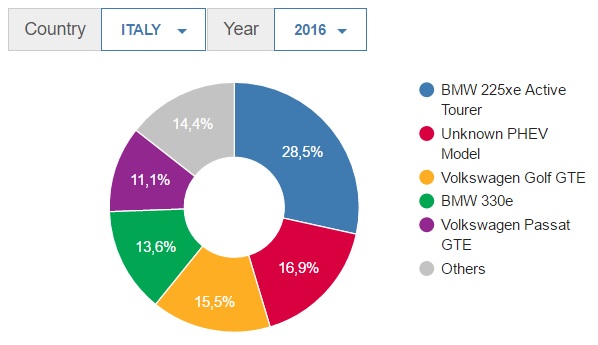
Passiamo ora a filtrare i dati che ci riguardano più da vicino. Di seguito si riportato i diagrammi a torta rispettivamente delle cinque vetture completamente elettriche (BEV) e delle cinque vetture ibride plug-in (PHEV) più vendute in Italia nel 2016.
Top 5 BEV Italia
Top 5 PHEV Italia
Questa è la tabella che riassume tutti i dati relativi alle vendite di auto elettriche a batteria (BEV) in Italia negli ultimi 5 anni:
| Ranking | Make | Model | YTD 2016 | Share PEV market | YTD 2015 | 2015 Total | Share PEV market | 2014 Total | 2013 Total | 2012 Total | 2011 Total |
|---|---|---|---|---|---|---|---|---|---|---|---|
| 1 | Nissan | Leaf | 228 | 22,8% | 209 | 390 | 18,3% | 332 | 323 | 146 | 5 |
| 2 | Citroen | C-Zero | 75 | 7,5% | 116 | 164 | 7,7% | 15 | 55 | 150 | 12 |
| 3 | Tesla | Model S | 69 | 6,9% | 12 | 120 | 5,6% | 52 | 8 | 0 | 0 |
| 4 | Mercedes | B250e | 40 | 4,0% | 6 | 79 | 3,7% | 0 | 0 | 0 | 0 |
| 5 | Unknown | BEV Model | 23 | 2,3% | 0 | 0 | 0,0% | 0 | 0 | 0 | 0 |
| 6 | Renault | Zoe | 21 | 2,1% | 169 | 326 | 15,3% | 155 | 203 | 0 | 0 |
| 7 | Peugeot | iOn | 16 | 1,6% | 0 | 5 | 0,2% | 25 | 14 | 116 | 11 |
| 8 | Volkswagen | e-Up! | 10 | 1,0% | 32 | 54 | 2,5% | 52 | 0 | 0 | 0 |
| 9 | BMW | i3 | 3 | 0,3% | 38 | 86 | 4,0% | 124 | 34 | 0 | 0 |
| 10 | Smart | Fortwo ED | 3 | 0,3% | 52 | 115 | 5,4% | 251 | 155 | 37 | 80 |
| Others | / | / | 4 | 0,4% | 18 | 57 | 2,7% | 34 | 2 | 14 | 5 |
Questa è, invece, la tabella che riassume tutti i dati relativi alle vendite di auto ibride “alla spina” (PHEV) in Italia negli ultimi 5 anni:
| Ranking | Make | Model | YTD 2016 | Share PEV market | YTD 2015 | 2015 Total | Share PEV market | 2014 Total | 2013 Total | 2012 Total | 2011 Total |
|---|---|---|---|---|---|---|---|---|---|---|---|
| 1 | BMW | 225xe Active Tourer | 138 | 13,8% | 0 | 0 | 0,0% | 0 | 0 | 0 | 0 |
| 2 | Unknown | PHEV Model | 82 | 8,2% | 0 | 0 | 0,0% | 0 | 0 | 0 | 0 |
| 3 | Volkswagen | Golf GTE | 75 | 7,5% | 0 | 180 | 8,4% | 0 | 0 | 0 | 0 |
| 4 | BMW | 330e | 66 | 6,6% | 0 | 0 | 0,0% | 0 | 0 | 0 | 0 |
| 5 | Volkswagen | Passat GTE | 54 | 5,4% | 0 | 0 | 0,0% | 0 | 0 | 0 | 0 |
| 6 | BMW | X5 40e | 30 | 3,0% | 0 | 67 | 3,1% | 0 | 0 | 0 | 0 |
| 7 | Mitsubishi | Outlander PHEV | 20 | 2,0% | 58 | 137 | 6,4% | 85 | 0 | 0 | 0 |
| 8 | Audi | A3 e-Tron | 5 | 0,5% | 11 | 23 | 1,1% | 23 | 0 | 0 | 0 |
| 9 | BMW | i3 Rex | 5 | 0,5% | 85 | 212 | 9,9% | 105 | 24 | 0 | 0 |
| 10 | Porsche | Cayenne PHEV | 5 | 0,5% | 22 | 32 | 1,5% | 8 | 0 | 0 | 0 |
| Others | / | / | 5 | 0,5% | 53 | 87 | 4,1% | 115 | 158 | 0 | 0 |
Statistiche sulle infrastrutture
Passiamo ora ad analizzare brevemente le statistiche relative alle infrastrutture, cominciando da un istogramma che riporta il numero totale di stazioni di ricarica per veicoli elettrici – raggruppate per tipologia: Normal charge (<=22 kW), Type-2AC, ChaDeMo, CCS (Combined Charging System) e Tesla supercharger – presenti in tutta Europa.
E concludiamo con la descrizione tabellare della distribuzione delle stazioni di ricarica per EV sui vari territori nazionali (in grassetto sono evidenziati i dati dell’Italia).
| Country | Charging Power | kW | # positions | # PEV per position |
|---|---|---|---|---|
| Austria | Normal Power | <= 22 | 2283 | 4 |
| High Power | > 22 | 380 | 24 | |
| Totals | 2663 | 3 | ||
| Belgium | Normal Power | <= 22 | 1335 | 8 |
| High Power | > 22 | 451 | 25 | |
| Totals | 1786 | 6 | ||
| Bulgaria | Normal Power | <= 22 | 18 | 1 |
| High Power | > 22 | 3 | 10 | |
| Totals | 21 | 1 | ||
| Croatia | Normal Power | <= 22 | 61 | 3 |
| High Power | > 22 | 18 | 11 | |
| Totals | 79 | 2 | ||
| Czech Republic | Normal Power | <= 22 | 209 | 5 |
| High Power | > 22 | 119 | 8 | |
| Totals | 328 | 3 | ||
| Denmark | Normal Power | <= 22 | 1398 | 6 |
| High Power | > 22 | 376 | 23 | |
| Totals | 1774 | 4 | ||
| Estonia | Normal Power | <= 22 | 25 | 47 |
| High Power | > 22 | 165 | 7 | |
| Totals | 190 | 6 | ||
| Finland | Normal Power | <= 22 | 706 | 2 |
| High Power | > 22 | 182 | 11 | |
| Totals | 888 | 2 | ||
| France | Normal Power | <= 22 | 11682 | 7 |
| High Power | > 22 | 1115 | 76 | |
| Totals | 12797 | 6 | ||
| Germany | Normal Power | <= 22 | 4587 | 12 |
| High Power | > 22 | 984 | 60 | |
| Totals | 5571 | 10 | ||
| Greece | Normal Power | <= 22 | 31 | 4 |
| High Power | > 22 | 2 | 66 | |
| Totals | 33 | 4 | ||
| Hungary | Normal Power | <= 22 | 158 | 1 |
| High Power | > 22 | 27 | 6 | |
| Totals | 185 | 0 | ||
| Iceland | Normal Power | <= 22 | 11 | 90 |
| High Power | > 22 | 11 | 90 | |
| Totals | 22 | 45 | ||
| Ireland | Normal Power | <= 22 | 715 | 2 |
| High Power | > 22 | 118 | 13 | |
| Totals | 833 | 1 | ||
| Italy | Normal Power | <= 22 | 1700 | 4 |
| High Power | > 22 | 76 | 98 | |
| Totals | 1776 | 4 | ||
| Latvia | Normal Power | <= 22 | 60 | 4 |
| High Power | > 22 | 11 | 23 | |
| Totals | 71 | 3 | ||
| Lithuania | Normal Power | <= 22 | 15 | 6 |
| High Power | > 22 | 3 | 34 | |
| Totals | 18 | 5 | ||
| Luxembourg | Normal Power | <= 22 | 202 | 5 |
| High Power | > 22 | 9 | 112 | |
| Totals | 211 | 4 | ||
| Malta | Normal Power | <= 22 | 206 | 0 |
| High Power | > 22 | 0 | 0 | |
| Totals | 206 | 0 | ||
| Netherlands | Normal Power | <= 22 | 20493 | 4 |
| High Power | > 22 | 512 | 182 | |
| Totals | 21005 | 4 | ||
| Norway | Normal Power | <= 22 | 6660 | 13 |
| High Power | > 22 | 872 | 101 | |
| Totals | 7532 | 11 | ||
| Poland | Normal Power | <= 22 | 290 | 2 |
| High Power | > 22 | 15 | 43 | |
| Totals | 305 | 2 | ||
| Portugal | Normal Power | <= 22 | 1192 | 2 |
| High Power | > 22 | 19 | 140 | |
| Totals | 1211 | 2 | ||
| Romania | Normal Power | <= 22 | 58 | 2 |
| High Power | > 22 | 1 | 141 | |
| Totals | 59 | 2 | ||
| Slovakia | Normal Power | <= 22 | 255 | 1 |
| High Power | > 22 | 79 | 4 | |
| Totals | 334 | 1 | ||
| Slovenia | Normal Power | <= 22 | 348 | 1 |
| High Power | > 22 | 31 | 11 | |
| Totals | 379 | 0 | ||
| Spain | Normal Power | <= 22 | 1378 | 6 |
| High Power | > 22 | 287 | 30 | |
| Totals | 1665 | 5 | ||
| Sweden | Normal Power | <= 22 | 1603 | 12 |
| High Power | > 22 | 452 | 45 | |
| Totals | 2055 | 10 | ||
| Switzerland | Normal Power | <= 22 | 3399 | 3 |
| High Power | > 22 | 413 | 31 | |
| Totals | 3812 | 3 | ||
| Turkey | Normal Power | <= 22 | 69 | 1 |
| High Power | > 22 | 7 | 13 | |
| Totals | 76 | 1 | ||
| United Kingdom | Normal Power | <= 22 | 8746 | 7 |
| High Power | > 22 | 2013 | 32 | |
| Totals | 10759 | 5 | ||
Come si può facilmente notare, da noi c’è ancora tanta strada da percorrere per incentivare la diffusione della mobilità elettrica…
Grazie per l’attenzione e alla prossima!
Team GAA










Commenti recenti